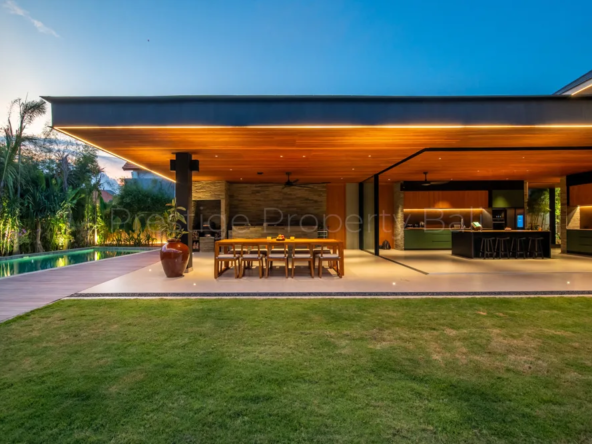

While wars and geopolitical tensions dominate global headlines, Bali’s property market is doing something unexpected, it’s getting stronger. Here’s the data-backed reality of buying Bali villas for sale in 2026.
If you’ve been watching global news lately and wondering whether now is the right time to buy a villa in Bali, you’re not alone. Middle East tensions, trade wars, and economic instability in Western markets have made many investors cautious. But the data tells a very different story for Bali, one that serious investors need to hear.
The short answer: Bali is not just surviving global uncertainty. In many ways, it is benefiting from it. This report breaks down exactly what’s happening in the Bali property market in 2026, backed by current market data, including Q3 2025 benchmarks, covering where prices are heading, which areas offer the best opportunity, how geopolitics are reshaping demand, and what smart investors are doing right now.
Table of Contents
Bali Villa & Property Market Trends 2026
Bali’s property market has completed its transition from the post-pandemic speculative frenzy of 2022-2024 into a more mature, fundamentals-driven cycle. For disciplined investors, this is actually better news than a bubble.
Market Fundamentals at a Glance
| Metric | Data Point | Trend |
|---|---|---|
| Median villa sale price | $299,000 (Q3 2025) | Stable |
| Headline market median (all types) | $280,000 (2025 full year) | -2.1% (mix shift) |
| Annual price growth (established areas) | 5-10% | Positive |
| Annual price growth (prime Canggu/Uluwatu) | 8-12% | Positive |
| Peak rental occupancy | 64.7% (July 2025) | Above 2024 |
| Average island-wide occupancy | 53-65% | Stable |
| Gross rental yield (prime locations) | 7-15% | Stable |
| Net rental yield (professionally managed) | 9-12% | Stable |
| Average daily rate (ADR) market-wide | $178 (-14% YoY) | Compressed |
| Total rental revenue (market-wide) | $1.21 billion (-16% YoY) | Pressure on generic |
| Villas as % of total supply | 86-87% | Dominant |
| Canggu corridor market share | 33.5% of all transactions | Leader |
| Off-plan inventory contraction | -9% YoY | Quality pivot |
| Total available listings | 12,300 (-7% YoY) | Tighter supply |
The market has split into two clear tiers. Premium properties, those with strong architecture, professional management, and strategic locations, are maintaining high occupancy and daily rates. Generic, poorly managed inventory is facing margin pressure. The message for buyers in 2026 is clear: quality matters more than ever. For a detailed breakdown of what properties actually cost across Bali’s corridors, read: How Much Does Property Really Cost in Bali?
For buyers looking to navigate this two-speed market, explore current villa listings in Bali to see how premium stock is performing against generic inventory.
The Two-Speed Market
Bali’s rental supply grew 107% over three years to 44,490 properties. That explosion in supply has pushed average daily rates down 14% year-on-year. However, this headline hides a crucial story: well-located, well-managed, high-specification villas in North Badung and Central Badung retained the strongest daily rate performance, with premium configurations commanding significantly above-market ADRs.
Four-bedroom properties appreciated 4.7% in median price to $530,000, and five-bedroom assets rose 1.1% to $795,000, both outperforming the broader market. North Badung retained the highest total sales value among regions at $605 million, confirming its status as Bali’s price-leadership corridor.
One-bedroom and two-bedroom properties now account for 43% of total supply and command the highest per-square-metre premiums, a global trend reaching Bali, where investors prefer lower capital entry points with stronger unit economics.
Key Insight – 2026 Market Structure
The listing-to-sold price gap is narrowing: 13.2% for the overall market and 8.3% for apartments. This signals healthier price discovery and more realistic seller expectations. Buyers now have genuine negotiating leverage, particularly on generic stock.
Geopolitical Impact on Bali Villas for Sale
One of 2026’s most defining investment narratives is how global instability is actively directing capital toward Bali rather than away from it. This dynamic is structural, not coincidental.
Indonesia’s ‘Safe Nation’ Status – Official Recognition
In April 2026, Indonesian President Prabowo Subianto, speaking at a Government Working Meeting, directly cited data placing Indonesia among the world’s safest nations in the context of global conflict. He noted that “if a Third World War breaks out, Indonesia ranks among the top” safe countries, and pointed to the number of Russians and Ukrainians who chose Bali as their base during the Russia-Ukraine war as live evidence of this dynamic.
This is no longer just a market narrative, it is now stated government policy. Indonesia is actively proposing to establish a special financial centre, with Bali among the candidate locations, to attract capital previously destined for the Middle East that is now being redirected due to regional tensions.
Capital Flight Dynamics
The early months of 2026 saw escalating tensions in the Middle East, combined with growing geopolitical rivalry among major powers, producing increased global market volatility. Investors from Dubai, London, and Sydney began actively reassessing geographic exposure. For Bali, the result is a surge in high-net-worth enquiry volume.
Traditional safe havens such as London, New York, and Singapore currently offer net rental yields of just 2%-4%, often barely outpacing inflation. Bali’s 8-12% net yields on professionally managed premium villas represent a compelling alternative for capital fleeing volatile Western markets.
The investor demographic is broadening significantly. While Australian investors remain the backbone of the market due to proximity, 2026 has seen a surge in UK and US buyers seeking ‘Plan B’ lifestyle assets. Meanwhile, the ‘Digital Nomad 2.0’ trend, wealthier, older professionals staying 3-6 months, has created strong demand for mid-term rentals, offering lower turnover costs and more stable occupancy than traditional short-stay tourism.
For a full breakdown of how to position capital safely in this environment, read: Invest in Bali in 2026: Property and Investment Guide
Geopolitical Impact on Rental Demand
ADR vs Occupancy – The Key Distinction
Geopolitical shocks typically reshape the composition of demand rather than destroy it. Occupancy in Bali can remain robust during periods of tension because domestic travel and rebookings by international guests fill gaps. However, ADR shows early softening under geopolitical strain. Owners must monitor ADR as the primary revenue indicator, stable occupancy can mask declining revenue if nightly rates are being discounted.
Chinese, South Korean, and Japanese visitor numbers are growing at 18-20% per year, reducing Bali’s historical dependence on Australian and European markets. This diversification supports year-round occupancy rather than seasonal peaks and provides a structural buffer when individual source markets are disrupted.
The practical implication for villa investors: properties with professional revenue management, dynamic pricing discipline, and multi-channel booking distribution are best positioned to capture rotated demand during geopolitical disruptions. Self-managed, Airbnb-only properties are most exposed.
Forecast and Price Predictions – Bali Villas 2026
Bali’s property market is not in one price cycle, it is in several, running simultaneously by location, product type, and management quality. Understanding which forecast applies to which asset is the critical skill for 2026.
Price Per Square Metre Benchmarks (2026)
| Area / Tier | Land Price (asking) | Built Villa (entry) | Luxury Resort Grade |
|---|---|---|---|
| Canggu (prime) | IDR 9-14M/m² ($530-$825) | $1,475+/m² | $3,500-$4,150/m² |
| Uluwatu / Bukit | IDR 5-8M/m² ($295-$470) | $1,200-$1,800/m² | $2,500-$3,500/m² |
| Pererenan / Seseh | IDR 4-7M/m² ($235-$412) | $900-$1,400/m² | $2,000-$3,000/m² |
| Ubud (entry) | IDR 2-4M/m² ($120-$235) | $1,060+/m² | $1,800-$2,500/m² |
| Tabanan / Emerging | IDR 1-3M/m² ($60-$180) | $700-$1,000/m² | N/A |
Exchange rate reference: Bank Indonesia JISDOR 16,981 IDR/USD (January 20, 2026)
Growth Forecasts by Corridor (2026)
| Corridor | 2026 Price Growth Forecast | 5-Year Cumulative Potential | Risk Profile |
|---|---|---|---|
| Canggu & Berawa | 5-8% | 35-50% | Low-Medium |
| Uluwatu & Bukit Peninsula | 8-12% | 45-70% | Medium |
| Pererenan | 6-10% | 45-65% | Medium |
| Seseh-Cemagi | 12-18% | 60-80% | Medium-High |
| Kediri & Kaba-Kaba | 15-22% | 65-80% | High |
| Ubud & Sanur | 5-7% | 30-45% | Low |
| Tabanan / Mengwi | 8-12% | 50-70% | High |
| North Bali (long-term) | 3-8% | 25-50% | Very High |
Sources: Investland Bali, Magnum Estate, Bamboo Routes, Propertia Bali, Bali Villa Realty (2025-2026 data)
Indonesia Real Estate Macro Forecast
Indonesia’s real estate market is projected to grow from USD 64.78 billion in 2024 to USD 85.97 billion by 2029. Primary residential sales grew 7.83% year-on-year nationally in Q4 2025, signalling renewed confidence. This macro tailwind underpins Bali’s property outlook beyond the island’s tourism fundamentals alone.
Infrastructure investment of approximately $95 million is underway across Bali, with mass transit planning, the Singaraja–Bangli road upgrade, and continued port improvements at Benoa. Historically, properties within reasonable proximity of completed transit or major road infrastructure in comparable Southeast Asian markets have commanded a 10%-25% premium over comparable properties without that access advantage.
Best Areas to Buy a Villa in Bali in 2026 – Current Market Data
Not all of Bali is performing equally. The island’s investment landscape has bifurcated between proven cash-flow corridors, high-appreciation growth belts, and emerging frontier zones. Here is where smart capital is moving in 2026, based on current transaction data through Q3 2025 and updated market intelligence.
Uluwatu & Bukit Peninsula – Growth Leader

Uluwatu has emerged as the top location for Bali property investment in 2026. The Bukit Peninsula registered a 13% growth surge over the past year, making it Bali’s fastest-growing sub-market. Top-performing villas report occupancy rates exceeding 83%, with best-in-class assets exceeding 90%.
The ‘Suluban Premium’ properties within 5 minutes of premium beaches like Suluban and Bingin command significantly higher occupancy rates and are considered the safest hedge against market volatility. Uluwatu land remains roughly 40% cheaper than in central Canggu, yet nightly rates are comparable or higher, creating a compelling location-arbitrage opportunity.
Infrastructure note: Some roads remain narrow, and internet connectivity can be unstable in more remote clifftop areas. Factor access quality into due diligence.
Best for: Luxury growth, capital appreciation, cliff-view premium villas. Forecast growth 8-12% annually. Browse current villas for sale in Uluwatu to see what investment-grade stock looks like in Bali’s fastest-growing corridor.
Canggu & Berawa – Cash-Flow Core

Canggu accounts for 33.5% of all property transactions in Bali, the single largest corridor. Canggu land prices command IDR 9-14 million per m² in prime areas, and built premium villas start near $1,475/m². This is Bali’s most proven rental market, with digital nomad and expat demand providing year-round occupancy.
Berawa represents the premium established product at the north end of the corridor, ideal for investors who prioritise execution certainty. Entry-level investment villas in the broader Canggu cluster start from approximately $179,000 in Pererenan. International schools, full supermarkets, and medical facilities are already established, making this Bali’s most complete investment infrastructure.
Best for: Rental yield, buy-to-let with strong management, and established demand. Forecast growth 5-8% annually.
Explore available properties in Canggu – Bali’s most liquid and proven rental market.
Pererenan and Seseh-Cemagi – Next Wave West

Pererenan and Seseh represent the intelligent spillover from saturated central Canggu. These areas experienced 25%-50% price appreciation in land and finished villas over the past two to three years and remain the strongest gentrification story on the island.
Pererenan combines relaxed village living with modern amenities, a growing selection of cafés, co-working spaces, and wellness venues. Seseh, characterised by peaceful black-sand beaches, is positioning itself as a future luxury enclave, with entry still achievable before prices fully converge with Canggu.
Early 2026 data shows Pererenan and Berawa among the neighbourhoods most likely to lead price growth this year, with 9%-13% projected appreciation, well above the island-wide average. Seseh-Cemagi could surprise with higher-than-expected growth as demand creeps outward from the already saturated Berawa.
Best for: Capital appreciation, ‘next Canggu’ positioning, balanced growth. Forecast growth 6-18%, depending on specific micro-location.
See current villa listings in Pererenan before prices fully converge with Canggu.
Ubud & Sanur – Stability Plays

Ubud attracts a fundamentally different buyer: wellness retreats, yoga centres, jungle villas for cultural immersion. Long-stay rental models suit Ubud’s demand profile, and the area provides consistent returns from wellness tourism. Entry-level built villas start around $1,060/m², the lowest of Bali’s established markets.
Sanur is quietly building a reputation as a family and long-stay alternative to busier south Bali. Investland Bali acquired 3,200 square metres of ocean-view land near the Sanur promenade in December 2024, reflecting institutional confidence in the area’s long-term fundamentals. Sanur offers stable long-term rental demand and growing interest from families and retirees.
Best for: Lower volatility, lifestyle buyers, stable long-term returns. Forecast growth 5-7% annually.
Tabanan, Mengwi & Frontier Zones

The Mengwi corridor is the fastest-growing sales area, accounting for 17.7% of transactions, driven by lower land prices, proximity to Canggu, and improving infrastructure. Investors watching the ‘next Pererenan’ are closely monitoring Tumbak Bayuh and Munggu. Tabanan (5.6% of transactions) shows early-stage momentum from an affordable base, with land prices 30%-50% below the Canggu corridor.
Important: As of February 2026, Bali has an active formal ban on new tourism construction on agricultural land covering six districts, Tabanan, Jembrana, Buleleng, Bangli, Karangasem, and Klungkung. All core investment areas (Berawa, Pererenan, Bingin, Uluwatu) are located in Badung regency and fall outside the formal ban scope, though province-wide agricultural land restrictions still apply everywhere.
Best for: Patient capital, land banking, the highest growth potential with the corresponding highest risk.
What Smart Investors Are Doing Right Now
The investors performing best in Bali’s 2026 market share a clear, disciplined playbook. They are not chasing cheap land in emerging areas with no track record. They are not buying off-plan from developers they do not know. The 2026 approach is legal-first, operations-focused, and defensive.
The Defensive Investment Framework
| Strategy Pillar | Why It Matters in 2026 | What to Do |
|---|---|---|
| Prioritise finished, ready properties | 38% of off-plan projects face delays of 12+ months; hard construction costs $1,300–$1,800/m² | Lock in today’s price, generate rental income from Day 1, and verify PBG/SLF immediately |
| Verify legal status first | Zoning enforcement increasing; July 2025 demolitions on Bingin Beach | Confirm ITR/KKPR zoning, PBG building permit, SLF certificate; correct leasehold or Hak Pakai structure |
| Focus on 2-3 bedroom configurations | 1-2BR units command highest per-m² premiums; 43% of supply; easiest to exit | Avoid oversized 4-6BR generic villas; these face oversupply and margin compression |
| Choose professional management | Professionally managed villas out-earn self-managed by ~30% | Evaluate management track record for rate discipline through geopolitical shocks, not just occupancy |
| Use location for strategy | Different corridors serve different investment objectives | Canggu for yield; Uluwatu for luxury growth; Pererenan/Seseh for appreciation; Ubud/Sanur for stability |
| Avoid nominee structures | The Indonesian government has strengthened the detection of assets at risk of seizure | Use PT PMA for freehold-equivalent control or properly structured leasehold (Hak Sewa) |
| Target 5-7 year hold horizon | Bali is an emerging market, not a liquid ETF | Model exit strategy; leasehold properties become harder to resell as remaining terms shorten |
The Mid-Term Rental Opportunity
One of 2026’s most significant demand shifts is the ‘Digital Nomad 2.0’ trend, where wealthier, older professionals choose stays of 3-6 months. Mid-term rentals offer lower turnover costs, more predictable income, and more stable occupancy than traditional nightly holiday lets. Investors structuring their villas to capture both short-term (high-season premium) and mid-term (off-season stability) demand are outperforming single-strategy properties.
Micro-Resort vs Standalone Villa
The 2026 market is seeing a structural shift from standalone villas to managed lifestyle resorts, properties integrating coworking spaces, wellness centres, padel courts, and in-house management teams. These assets command yield premiums, qualify for commercial accommodation zoning (reducing regulatory risk), and attract a broader guest demographic. For new entrants, the villa market remains accessible; for investors seeking the highest-returning tier, the lifestyle resort model is where institutional capital is flowing.
Read more: Finding Your Base: The Best Bali Neighbourhoods for Digital Nomads in 2026
Indonesia Macroeconomic Fundamentals
Bali’s property market does not operate in isolation. Its resilience is underwritten by Indonesia’s macroeconomic stability, one of the most robust in Southeast Asia.
GDP Performance and Outlook
| Indicator | Data Point | Source / Date |
|---|---|---|
| GDP growth (full year 2025) | 5.11% | BPS Indonesia, Feb 2026 |
| GDP growth Q4 2025 | 5.39% YoY (strongest since Q3 2022) | BPS Indonesia |
| GDP growth target 2026 | 5.4%-6.0% | Finance Ministry / IMF, Feb 2026 |
| GDP growth forecast 2026 (consensus) | 4.9%-5.0% | FocusEconomics / IMF |
| Investment realization Q3 2025 | IDR 491.4T (+13.9% YoY) | BKPM |
| Trade surplus (Jul–Aug 2025) | USD 9.67 billion (+195% YoY) | BPS Indonesia |
| Inflation (Sep 2025) | 2.65% (within BI target range) | Bank Indonesia |
| Public debt-to-GDP | Below 40% | IMF |
| Sovereign credit ratings | Baa2 (Moody’s), BBB (S&P & Fitch) | Rating agencies |
| G20 membership | Yes, 4th largest population globally | World Bank |
| Digital economy GMV | USD 90 billion | Google-Temasek 2025 |
Indonesia enters 2026 with a stable growth base. GDP growth should hover near the 5% mark for the fifth consecutive year. United Overseas Bank analysts described Indonesia’s economy as ‘poised for stronger growth, potentially approaching 6%, driven by investment, technology transfer, and government support.’ Public stimulus is expected to boost domestic demand, largely offsetting any deceleration from US tariffs and softer global demand for commodities.
Tourism Contribution & Outlook
According to the World Travel & Tourism Council, Indonesia’s tourism sector reached IDR 1,269.8 trillion in 2025, 21% higher than in 2019, representing 5.5% of GDP. International visitor spending hit a record IDR 344 trillion, up 12% from the 2019 record.
For 2026, Indonesia targets 16-17.6 million international arrivals nationally and 6.5-7 million to Bali specifically. Tourism could generate USD 22-24.7 billion in foreign exchange. Employment in the tourism sector is projected to reach 26.5 million, generating 3 million new jobs compared to 2025.
The Ministry of Tourism’s 2026 strategy explicitly shifts from volume to quality-driven growth, discouraging mass, low-value development in favour of eco-friendly resorts and wellness retreats. This policy direction is designed to ensure that Bali assets retain exclusivity and long-term appeal, actively protecting investor value at the regulatory level.
Bali Tourism Source Markets – Growing Diversification
| Source Market | 2024 Arrivals (Bali) | Trend | Significance |
|---|---|---|---|
| Australia | ~23% of arrivals | Stable backbone | Core yield driver |
| India | 550,379 (2024) | Fast growth | Rising disposable income |
| China | 448,446 (2024) | +18-20% YoY | Improving connectivity |
| South Korea / Japan | Growing | +18-20% YoY | Reduces seasonality |
| UK / Europe | Growing (2026 surge) | New ‘Plan B’ buyers | Property buyer pool |
| Russia / Ukraine | Significant presence | Conflict-driven relocation | Long-stay demand |
Key Risks to Be Aware Of in 2026
A responsible analysis must include the risks. Bali is not without challenges, and informed investors need to understand where caution is warranted before committing capital.
- Off-plan construction risk: Approximately 38% of off-plan projects proposed in the last 24 months have faced delays of 12 months or more. Hard construction costs now range from $1,300-$1,800 per m², making fixed-price contracts risky for developers and buyers alike.
- Oversupply in generic villas: The market has an excess of large, undifferentiated 4-6-bedroom villas. ADR fell 14% market-wide in 2025 under competitive pressure. Compact, well-designed 2-3 bedroom units in prime locations continue to outperform.
- Regulatory changes: Zoning enforcement has intensified significantly. The July 2025 demolitions on Bingin Beach targeted villas violating setback and zoning laws. New business licensing requirements (PP 28/2025) and construction moratoriums in six districts require careful pre-purchase due diligence.
- Currency exposure: All rental income and sale proceeds are in Indonesian Rupiah or USD. For non-USD investors, IDR/USD fluctuations can affect repatriated returns. Over multi-year holding periods, this typically smooths, but short-term horizons carry FX risk.
- ADR compression risk: Geopolitical disruption can soften nightly rate pricing power even while occupancy appears stable. Owners relying on occupancy percentages alone may miss early signs of revenue decline. Monitor RevPAR (Revenue Per Available Room), not just occupancy.
- Nominee structure risk: The Indonesian government has materially strengthened the detection of nominee land and share arrangements. Assets held under such structures are vulnerable to seizure. Use PT PMA or properly registered leasehold structures only.
- Liquidity risk: Bali property is not a liquid asset. Selling can take months, and leasehold properties become harder to resell as the remaining lease term shortens. This is a 5-7-year minimum-horizon asset class.
All of these risks are avoidable with proper guidance. Read: 8 Crucial Mistakes to Avoid When Buying Property in Bali
Conclusion: Bali in 2026 Is a Buyer’s Market for Smart Capital
The Bali property market in 2026 is no longer for the speculator chasing quick gains. That era ended with the post-pandemic boom. What remains is something more valuable for the long-term investor: a fundamentals-driven market where quality, location, and legal compliance determine who wins.
Global uncertainty is not pushing serious buyers away from Bali, it is filtering out the noise and leaving behind the investors who understand what they are buying and why. Indonesia’s President has publicly acknowledged the country’s ‘safe nation’ status and is actively pursuing policies to attract capital displaced by geopolitical tension elsewhere.
The island welcomed over 6.3 million international tourists in 2024, with 6.5-7 million targeted for 2026. Indonesia’s economy grew 5.11% in 2025 and is targeting 5.4%-6% in 2026. Capital from Dubai, London, and Sydney is actively seeking a home. Bali, with its combination of yield, lifestyle, geographic safety, and institutional macro framework, is well-positioned to receive it.
If you’re ready to move from research to action, browse Bali villas for sale at Prestige Property Bali, vetted, legally compliant listings across Bali’s highest-performing corridors.
The 2026 Investment Thesis in Brief
Finished, legally compliant 2-3 bedroom villas in Uluwatu, Canggu/Berawa, or Pererenan, managed by a professional operator with a track record of ADR discipline, targeting a 5-7 year hold. This is not hype, it is the trade the data supports.
Frequently Asked Questions
Is it safe to invest in Bali property in 2026?
Yes, with the right approach. The market is stable with a 5-10% annual price growth forecast in established areas. Indonesia holds investment-grade sovereign credit ratings (Baa2/BBB), and its president has publicly cited the country’s safety relative to global conflicts. The key is choosing finished, legally compliant properties with professional management in high-demand locations. Avoid off-plan projects and oversized generic villas.
How does global conflict affect Bali property prices?
Counterintuitively, global tensions tend to push capital toward Bali rather than away. Indonesia is being formally proposed as a financial safe-haven hub, with Bali as a candidate location.
High-net-worth investors from Dubai, Europe, and the US are actively relocating assets to Southeast Asia. The key risk is ADR compression during periods of disruption, occupancy often holds, but nightly rate discipline requires active revenue management.
What is the best area to buy a villa in Bali in 2026?
For rental yield: Canggu and Berawa. For capital appreciation and growth leadership: Uluwatu and Bukit Peninsula. For next-wave appreciation: Pererenan and Seseh-Cemagi. For long-term stable value: Ubud and Sanur. For frontier upside with high risk: Kediri, Kaba-Kaba, and Tabanan.
What rental yields can I expect from a Bali villa in 2026?
Gross yields range from 7-15% in prime locations. Net yields for professionally managed properties average 9-12%. Properties with strong management teams consistently out-earn self-managed alternatives by approximately 30%. Institutional-grade lifestyle resort communities project 17-20% gross yields. Long-term residential rentals produce 5-9% gross yields with 85-90% occupancy stability.
Should I buy freehold or leasehold in Bali?
Both structures offer strong investment potential. Freehold-equivalent control via PT PMA (a foreign-owned company) offers maximum security and resale value but requires a minimum capital of approximately USD 600,000. Leasehold (Hak Sewa) offers lower entry prices, with lease terms averaging 25-30 years and often extendable. A 30-year lease with a guaranteed extension operates financially like a freehold asset for the first generation of ownership. Never use nominee structures, these expose assets to government seizure under increasingly enforced regulations.
For a step-by-step walkthrough of the legal process, see: How to Buy Property in Bali (2026) and How to Buy Land in Bali as a Foreigner
Disclaimer and Data Sources
This report is compiled for informational purposes. Data sourced from BPS Bali (Central Statistics Agency), Bank Indonesia, AirDNA Bali, Investland Bali, Suasa Real Estate, Bamboo Routes, Propertia Bali, Bali Villa Realty, Magnum Estate, Coco Development Group, IMF World Economic Outlook, World Bank Indonesia, FocusEconomics, Indonesia Ministry of Tourism, and WTTC. Property prices and market data as of Q3 2025–Q1 2026. Readers should conduct independent due diligence and consult licensed legal and financial advisors before making any investment decision. This report does not constitute investment advice.